Cohort Analysis Usage Guide
The bitmapist.cohort module provides a simple workflow: generate a form to query the data, fetch the data from Redis, and then render it as HTML or CSV.
1. Generating the Query Form
To allow users (or yourself) to interactively explore the data, you can generate an HTML form with render_html_form.
from bitmapist import cohort

# Define the event options for the dropdown menus
selections_first_event = [
    ('Signed Up', 'signup'),
    ('Are Active', 'user:active'),
]

selections_second_event = [
    ('Task completed', 'task:complete'),
    ('Are Active', 'user:active'),
]

# Generate the form HTML
html_form = cohort.render_html_form(
    action_url='/analytics/cohort',
    selections1=selections_first_event,
    selections2=selections_second_event
)

# You can now render this HTML string in your web application
print(html_form)
This function takes several arguments to customize the form, including the form's action_url, lists of selectable events, the default time grouping, and more.
2. Fetching Cohort Data
The core of the module is the get_dates_data function. It takes the user's selections and fetches the corresponding data from Redis, performing the necessary bitwise operations to calculate cohort sizes and retention numbers.
Typically, the arguments for this function would come from the web request generated by the form above.
# These values would come from your web framework's request object
# e.g., request.GET.get('select1')
params = {
    'select1': 'user:active',
    'select2': 'task:complete',
    'time_group': 'days',
    'num_results': 14, # How many cohorts to show (e.g., last 14 days)
    'num_of_rows': 7,  # How many follow-on periods to show (e.g., next 7 days)
    'as_percent': True,
}

dates_data = cohort.get_dates_data(**params)
The get_dates_data function returns a list of lists, where each inner list represents a cohort (a row in the table). The structure is:
[[datetime_of_cohort, total_users_in_cohort, value_for_period_0, value_for_period_1, ...], ...]
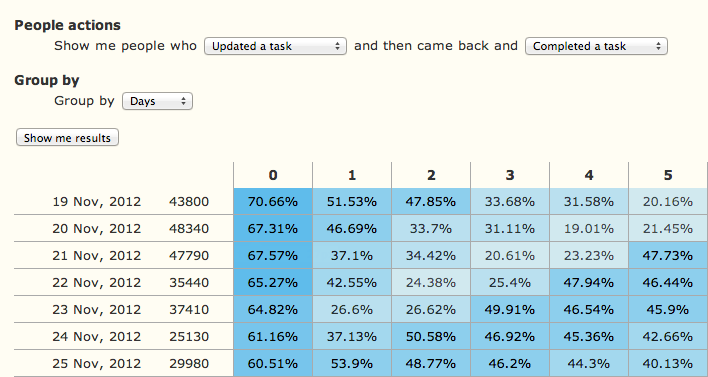
3. Rendering the Data Table
Once you have the dates_data, you can render it as a color-coded HTML table using render_html_data.
html_data = cohort.render_html_data(
    dates_data,
    time_group=params['time_group'],
    num_results=params['num_results'],
    num_of_rows=params['num_of_rows'],
    as_percent=params['as_percent']
)

# Render this HTML string in your application
print(html_data)
This will produce a table similar to the screenshot below, showing the initial cohort size and the percentage (or raw count) of users who returned to perform the second action in the subsequent periods.
You can also export the data as CSV using render_csv_data.
csv_output = cohort.render_csv_data(dates_data, as_percent=True)
# This can be returned as a downloadable file