Cohort Analysis Overview
Bitmapist includes a powerful cohort module for performing cohort and retention analysis on your event data. This feature allows you to understand how user behavior evolves over time and answer critical questions about your product.
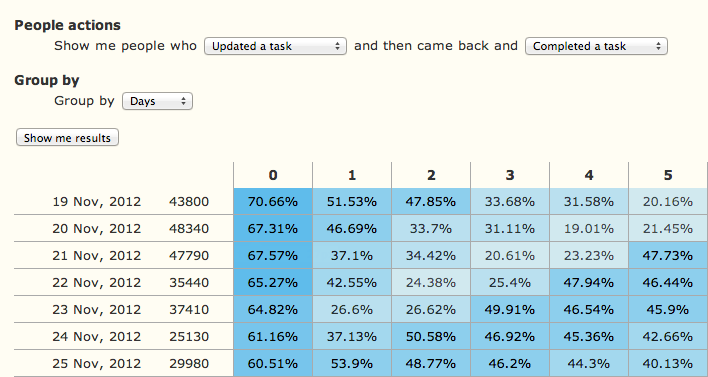
What is Cohort Analysis?
A cohort is a group of users who share a common characteristic. In the context of bitmapist, this is typically users who performed a specific action within the same time period (e.g., all users who signed up in the first week of January).
Cohort analysis tracks these groups over time to see how their behavior changes. For example, you can answer questions like:
- User Retention: Of the users who signed up in January, what percentage were still active in February, March, and April?
- Feature Adoption: Of the users who were active last week, what percentage used a new feature this week?
- Conversion Funnels: Of the users who viewed a product page, how many added it to their cart and then completed a purchase over the following days?
How it Works in Bitmapist
The bitmapist.cohort module provides functions to:
- Fetch cohort data directly from your existing bitmapist events.
- Render the data as an HTML table for easy visualization.
- Render a user-friendly HTML form to allow for interactive exploration of the data.
This functionality is inspired by tools like Mixpanel Retention but operates directly on your own Redis data, giving you full control and real-time insights without sending your data to a third-party service.
To get started, see the Usage Guide.